Adding in Homelab monitoring with Prometheus, Node Exporter, and Grafana
In a previous post I mentioned one of the updates that I wanted to make to the current homelab environment was to add in more observability in the form of logging, monitoring, and alerting. I am still testing a few logging options, including using the NAS as a syslog server, but this guide will focus mainly on the monitoring with a sprinkle of alerting at the end.
Monitoring my Synology
When I first got my DS920+ a few years ago I setup a monitoring system for it by cobbling together several guides and before I truly understood how to properly configure the Synology for containers/metrics/etc. After many hours of coffee, editing config files, and swearing I had a pretty Grafana dashboard that broke after a week. Looking back at the code I had mashed together its a wonder it worked for that long.
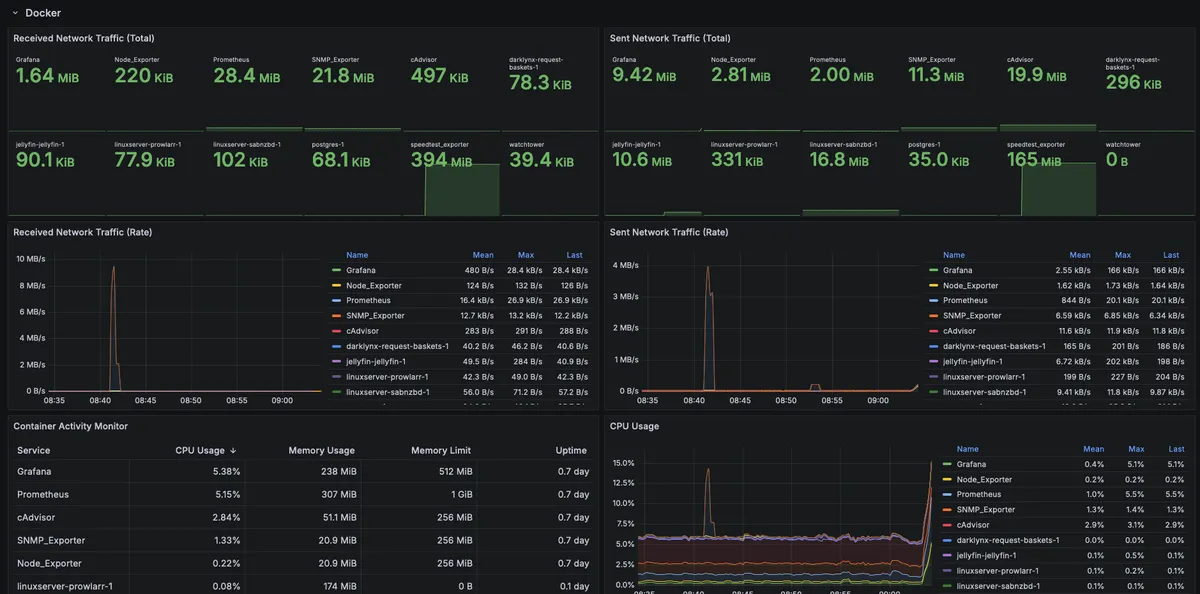
This time around I decided to be a bit more patient, read some guides and start the process from the ground up again. I found a fantastic guide from wozniakpawel on Github that had me up and running in about 5 minutes. Bonus, the repo includes an Overly Comprehensive Grafana dashboard.

As prep work for this I also did the following on the Synology:
- Set up a dedicated Docker user with limited permissions to the rest of the NAS. The user has some permissions around networking and the
/volume1/dockerfolder, but beyond that can't do much. - Set up a dedicated Docker network for all the containers running on the NAS.
- Set up HyperBackup for the Docker File station volume.
Monitoring my linux and macOS systems
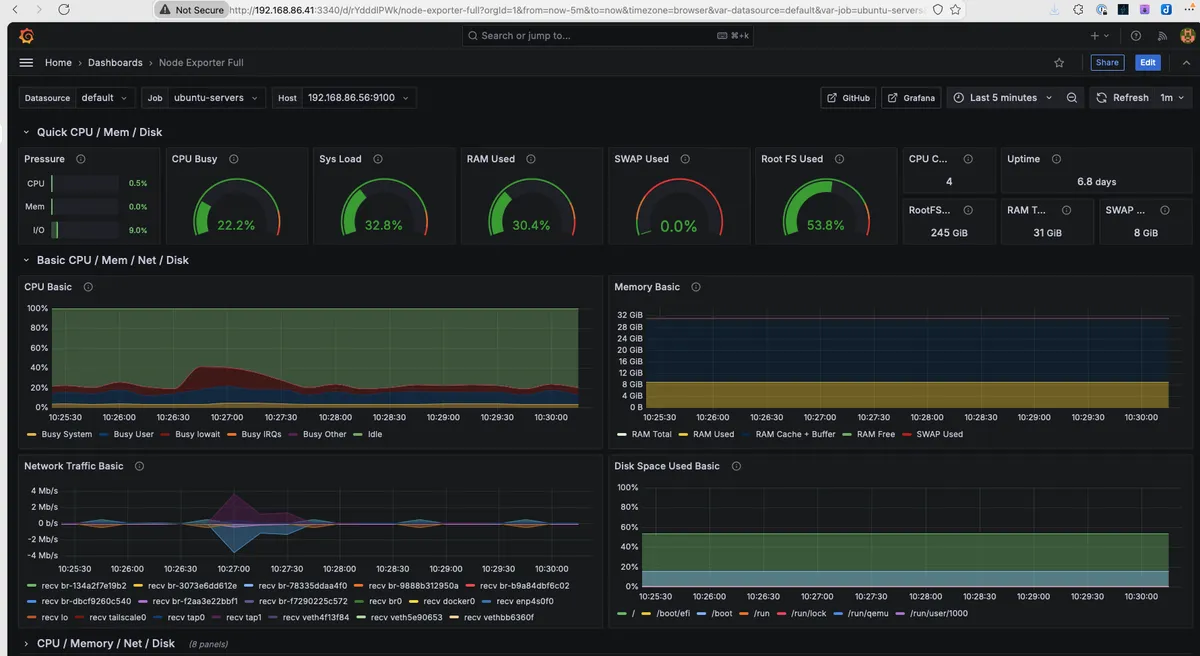
With Prometheus And Grafana now chugging along on the NAS, I turned to my 2 Ubuntu servers and my 2 Mac systems. I installed Node Exporter on all the systems and then updated the prometheus.yml file on the NAS to include the new hosts.
  - job_name: 'ubuntu-systems'
    scrape_interval: 10s
    static_configs:
      - targets: ['192.168.86.56:9100', '192.168.86.60:9100']

  - job_name: 'macos-systems'
    scrape_interval: 10s
    static_configs:
      - targets: ['192.168.86.24:9100', '192.168.86.40:9100']
You may need to restart the Prometheus container on the NAS to pick up the updated config file.
I am building a few rudimentary dashboards to get the query syntax down, but to get a more comprehensive view of the hosts while I up my skills, I also imported the Node Exporter Full dashboard.

Monitoring homelab services
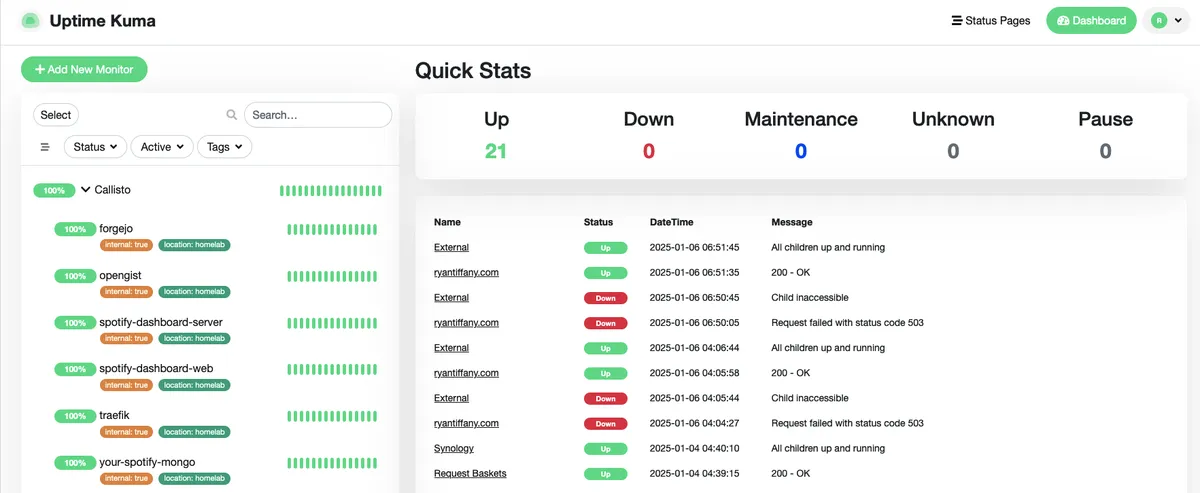
I settled on Uptime Kuma as my status and service tracker. It is configured to monitor the status of the docker containers on the NAS and 2 ubuntu servers as well as local services like Jellyfin, postgres, and some of my external sites. I set up alerting for some of the services using Discord webhooks and can now respond a lot quicker when something is amiss.

Next steps
- Grafana also supports Discord webhooks as an alerting mechanism but I want to spend some time trying to determine which metrics make sense to alert on and customizing the alert message template to allow for interaction.
- Install and configure
rsnapshoton the Ubuntu servers to backup to the NAS daily and weekly with a 6 month retention scheme.